MAS Health comes with the infrastructure for us to establish health measures for assets and locations defined in MAS Manage. Much the same way we keep ourselves healthy, we can set up “vitals,” for our groups of assets or locations that can be updated either manually or automatically as new data arrives. As with a person, there are several key vitals you can keep track of to maintain health. While no one vital (or contributor) is a complete indicator, as a group these contributors can paint an overall picture of health and point out areas of improvement. “Your blood pressure and cholesterol look good, but you could stand to lose a bit of weight.”
Anomalies in the data can also point to misuse of the equipment or transient situations that can be detrimental to the long-term health of the equipment. Think of the adage, “Rode hard and put away wet.” A higher number of corrective work orders on seemingly healthy assets can indicate self-induced problems.
In this article we are going to walk through each of the health indicators that MAS Health uses to ascertain MAS Manage equipment and location health. The key concept is that of “contributors” to the health of the entity. These are actual data sources such as asset / location meters or calculations based upon data records within Manage. Each given a weighting as to their impact, they are summed up to visualize the health of individual or groups of assets (or locations).
One note of admonition: Be sure that you document, and revision control any formulas or scoring methods that you develop. Over time you will make adjustments that will impact how the data looks and the story it tells. The foundation and the changes will need to be documented, understood, and agreed upon by those making decisions with the results.
Contributors/detractors from health – What is health?
MAS Health uses the concept that there are several contributors to the health of an asset or location, each of which is weighted based upon its assumed impact. Assets / locations are grouped in such a way so that the same contributor sets are applied, providing a consistent view of health.
There are two types of contributors (or drivers) in Health:
- Meters
- Formulas
Here is a link to further information on formulas where you can easily see the complexity you could achieve: IBM IoT Community
Given that Health is connected directly to the Manage application set, it has access to read meters that have been associated with Asset and Location records. It does not matter if the meter readings are entered manually, via an interface, or via the IoT Platform directly from sensors. As the meter readings/values are updated, Health can read them as contributors to the health of the asset or location. (A quick note on the IoT Platform: It is part of the MAS solution and enables connections to equipment telemetry sources. These data streams can then update Meters on Assets and Locations directly in Manage with no manual entry needed. The connection between Manage and IoT Platform is performed via Administration – Interfaces in Manage.)
For example, a pressure meter on an asset could be defined with a normal operating range. Values outside that range detract from the health of the asset over time. Also, a meter that tracks run hours gives an indication of decreasing health as the hours stack up. Further, an oil condition meter that shows results of oil analysis can be an excellent indicator of health. For a location, a condition meter could be added that is updated because of facilities inspections.
As mentioned, each contributor is weighted. Perhaps the pressure and run hours meters have a small contribution, but the oil condition has significant impact. In this case, pressure and run hours might be set at 20% each and oil condition set for 60%.
Health contributors can also be based upon built-in or developed formulas. Knowing that MAS Health has a direct connection to MAS Manage, practically any field or record in Manage can be used as data elements to perform calculations upon. If you already have methods or formulas developed to crunch data coming out of your maintenance systems, those same formulas can be introduced in Health as weighted contributors as well.
No matter if the contributor values are current meter readings, or results of formulas, the values are normalized to fit into the range of values that define the health score. Then the weighting for each is performed resulting in an overall score for Health.
In the end, Health shows you the relative health situation the asset (or location) is in now. You could consider the health “level” to be an indicator of the probability of failure. The worse the health, the higher probability of failure. More on this later.
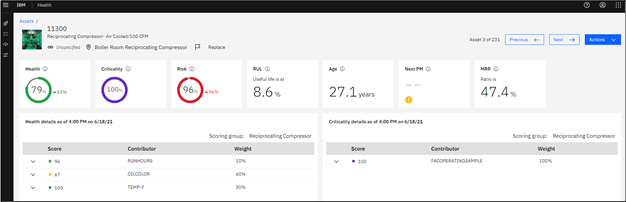
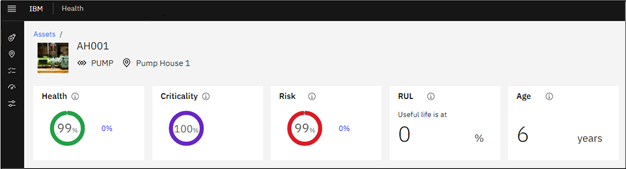
The Health indicator (and list of contributors) shows how the Run Hours, Oil Condition, and Temperature all contribute to the slightly degraded health of the asset.
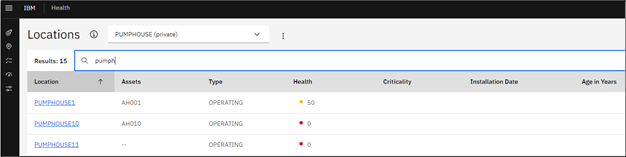
Here is a sample screenshot of Locations. Most all the same indicators and discussion points in this article are available for Locations.
Criticality is based upon the impact on operations – Consequence
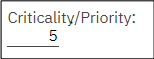
We are headed towards a risk calculation, so we need a consequence factor. MAS Health uses Criticality as an element of health that you determine its range. If an Asset or Location is critical to the operation, or a failure has severe consequences, then the range might be a simple 1. Or you can take advantage of the Asset records “Priority,” field in Manage to indicate criticality. Whatever the Priority field is set to on the Asset record is the indication of Criticality in Health.
Of course, as with Health contributors, you can develop formulas to establish Criticality, using record fields in Manage as needed.
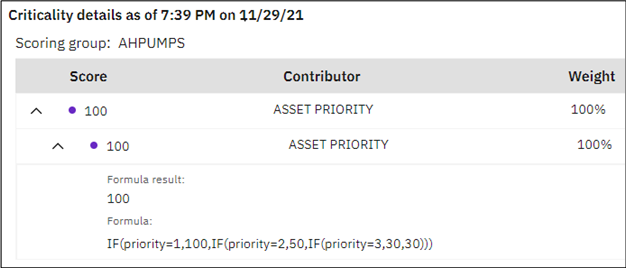
A simple formula is as follows. Here, if the Asset (or Location) Priority field has a value of 1 (the highest priority in our context) then the resulting value sent to the Criticality Score is “100.” The lowest value, “3,” results in the lowest Criticality Score of 30. (The last “30” is in case the Priority value is not 1, 2, or 3, then it returns the “worst,” value of 30 or whatever is present there in the formula.)
IF(priority=1,100,IF(priority=2,50,IF(priority=3,30,30)))
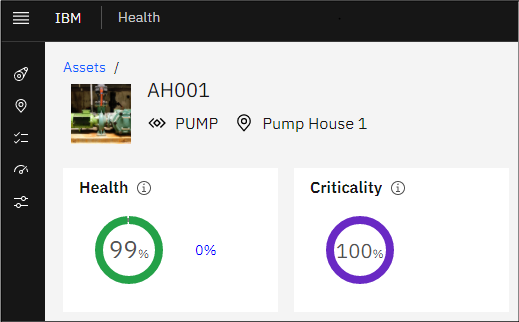
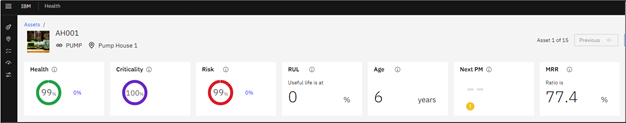
Since the AH001 asset priority is set to 1 in Manage, this returns a Criticality of 100%
Risk = Probability x Consequence
Risk in Health is calculated as: The remainder of the health score/100 x the Criticality score. Example:
Health score = 99%
Criticality = 100
Risk = (99/100) x 100 = 99%
Here is the full formula used for the Risk contributor:
IF((ISNULLF(ASSETLOCSCORE(“health”)) || ISNULLF(ASSETLOCSCORE(“criticality”))), NULLVALUE(),((100-ASSETLOCSCORE(“health”))/100)*ASSETLOCSCORE(“criticality”))
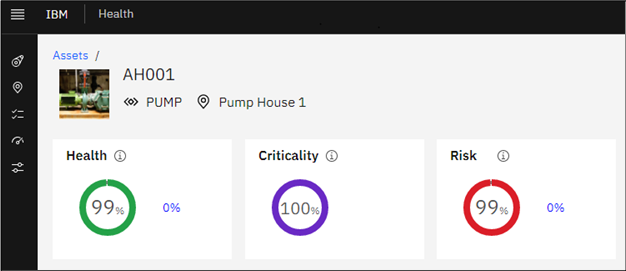
You might be asking yourself why does a nearly perfectly Healthy asset present such a high-Risk level? Well, that’s due to the high Criticality… Priority 1… in our case.
Certainly, you will need to refine your scoring levels and underlying contributors to suit your goals. You will need to go around the race track a few times to settle your approach to these new indicators. Make sure you document the formulas and the assumptions made so that everyone understands what is being presented.
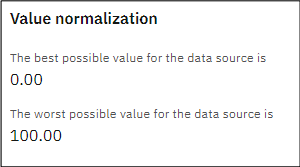
One final thing to mention about defining Contributors, is the best / worst values that the Scoring ranges need. After you make your definitions, you enter the best / worst values the formulas calculate and where they would fit on the range. Below is an example for Risk where best case is 0% risk and worst case is 100% risk.
Remaining Useful Life (RUL) and Age
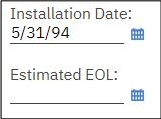
Age simply takes the current Manage/Maximo system date and subtracts the Installation Date field value from the Asset record. Not much more to say about that. You do have this field populated in Manage, right?
RUL is a simple element of Health that is based upon field values on the Asset record in Manage. Given:
- Manufacturers Expected Life (MEL) = 30 years
- Age = 10 years
- RUL = MEL – Age = 20 years or 66%
When the Age exceeds the MEL, the RUL will = 0%.
These are rather subjective measures, but given easy entries into common Asset record fields, they do give you a sense of the aging of your equipment.
Maintenance to Replacement Ratio (MRR)
If you have been capturing Actual costs via work orders in Manage/Maximo, then the Maintenance to Replacement Ratio measure will be useful to you. The calculation is simple:
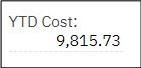
- Current total cost of all maintenance for the Asset (YTD Costs field on Asset record)
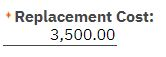
- Replacement Cost (field on Asset record)
- MRR = YTD Costs/RepCost = $220 / $880 = 27.5%
- or
- MRR = 9815.73 / 3500 = Well over 100% (You blew it!)
The point of MRR is to give you a sense of when you need to stop maintaining a piece of equipment and begin to make plans to replace it. It is based solely upon values in Asset record fields, and the capture of Actuals via work orders, so there is a degree of data collection needed before this measure can be useful to you.
Take actions/plan
So, you have some entities in not such good health. Now what?
Simple: Act or make plans. Now that you have objective data and measures as to what health means, you can use these data points to make decisions. Take a hard look at the assets with the worse health and decide how to either make their health better, extend their useful life, or begin planning for replacement. One could argue that it is also a good opportunity to make sure the health indicators are giving you a true picture of asset health. Out in the world there are some very old pieces of equipment that are in very good health and are expected to maintain good health for a long time. Be sure your data collection and formulas are truly reflecting the context of your equipment.
Article by John Q. Todd, Sr. Business Consultant at TRM. Reach out to us at AskTRM@trmnet.com if you have any questions or would like to discuss deploying MAS 8 or Maximo AAM for condition based maintenance / monitoring.
0 Comments